DS Salary Analysis Project
Introduction
The DS Salary Analysis Project is an application designed for visualizing and analyzing data science salary information. The application is built using the Tkinter library for the user interface and Matplotlib for data visualization. It leverages custom styling and plot generation to provide an intuitive and interactive experience for users to explore salary data across various dimensions.
- Utilizes the Tkinter library to create a user-friendly interface with a modern appearance using customtkinter.
- Generates dynamic plots (bar charts, pie charts, box plots) using Matplotlib to visualize salary data.
- Allows users to analyze data by job title categories, experience levels, and locations.
Features
- User-friendly interface
- Dynamic data visualization
- Category analysis by job title, experience level, and location
Technologies Used
 Python
 CustomTkinter
 Matplotlib
 Pandas
Dataset Analysis
- Data: data science salaries
- Details: job titles, experience levels, locations, employment types
- Analysis: salary trends across various dimensions
Dataset Analysis
The dataset used in this project contains information on data science salaries, including details such as job titles, experience levels, locations, and employment types. The data is analyzed and visualized across various dimensions to provide insights into salary trends in the data science field.
Examples
Bar Chart
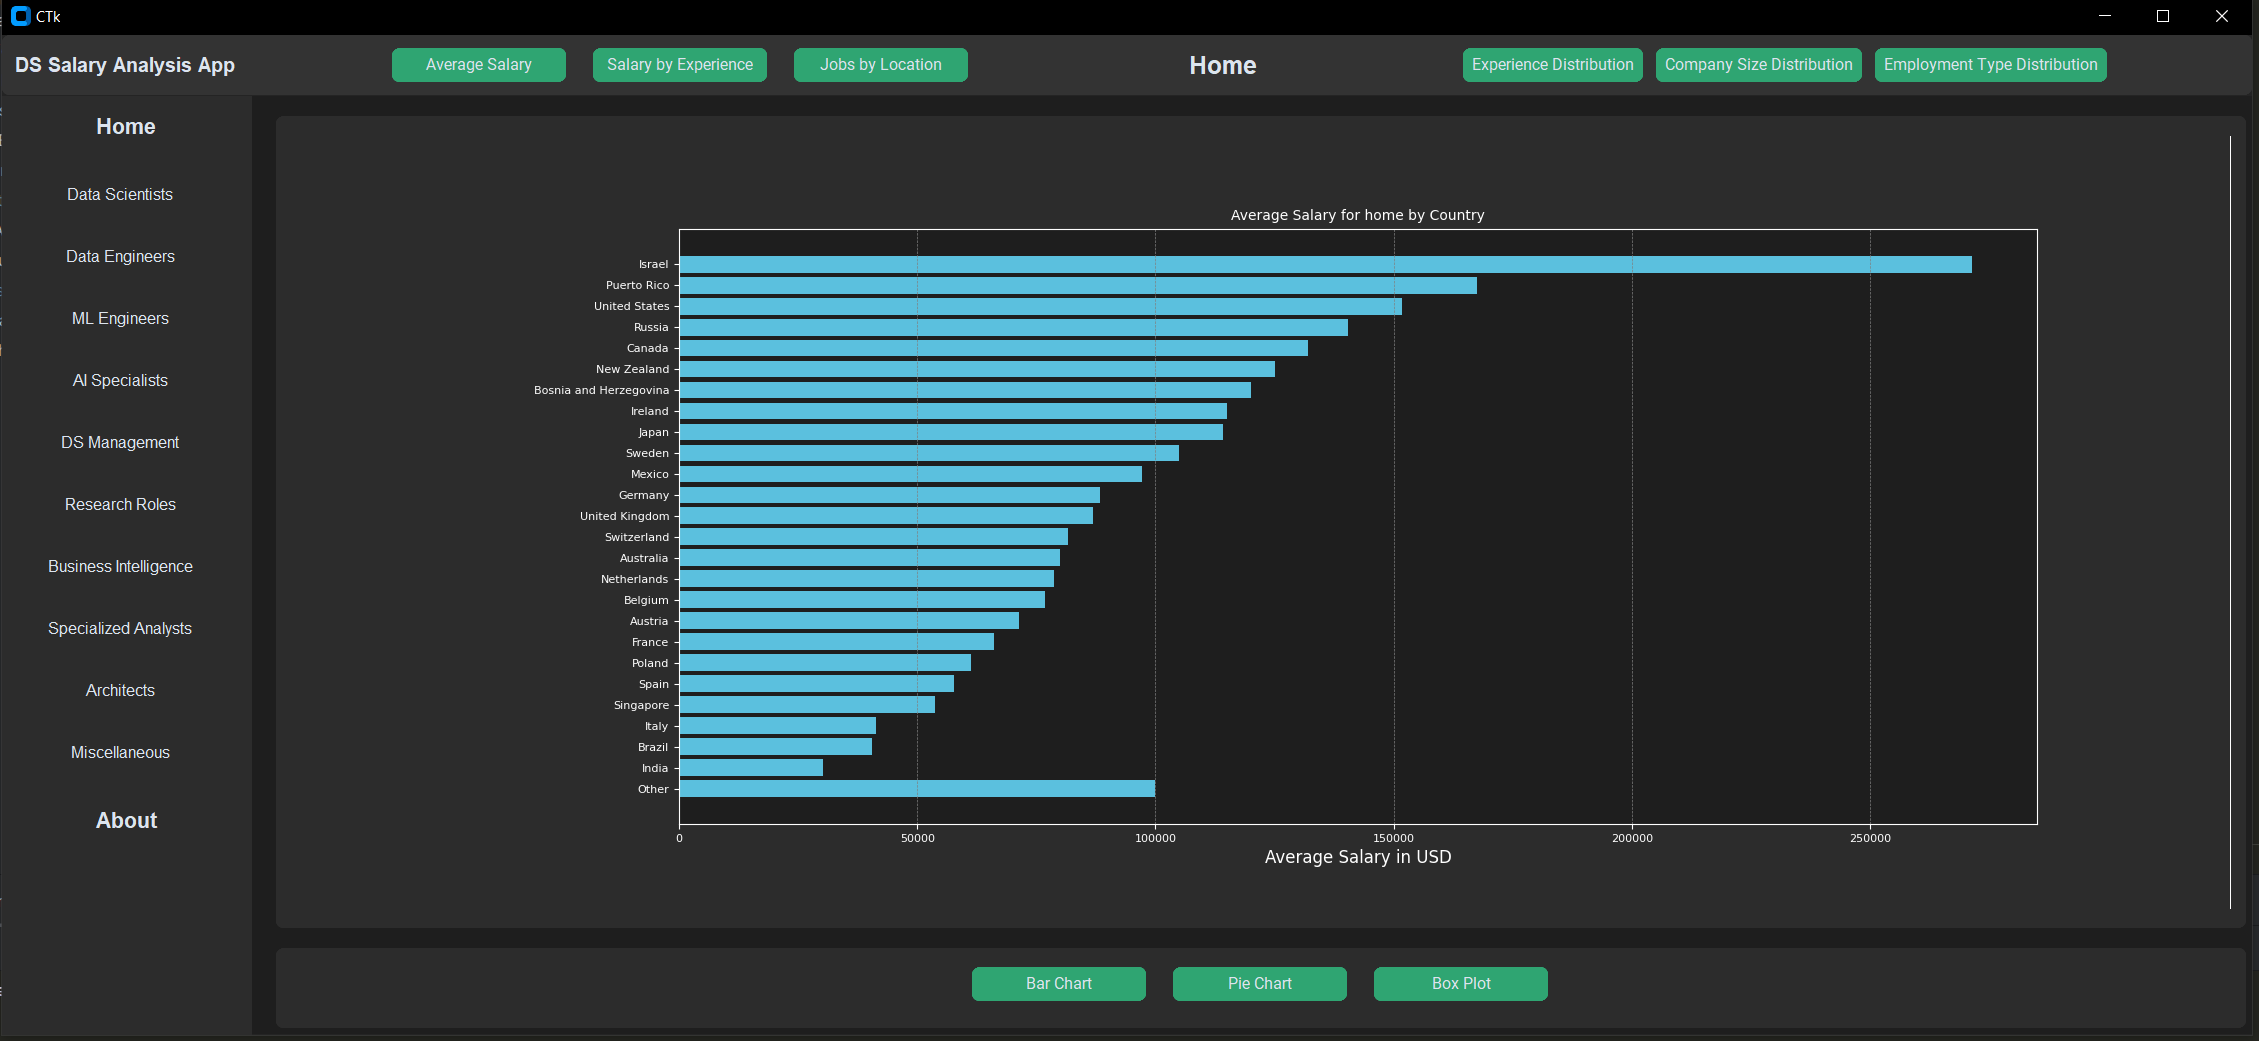
This demonstrates a bar chart for the selected dataset. Such statistics are available for:
- Average salary
- Salary by experience
- Jobs by location
- Experience distribution
- Company size distribution
- Employment type distribution
Box Plot
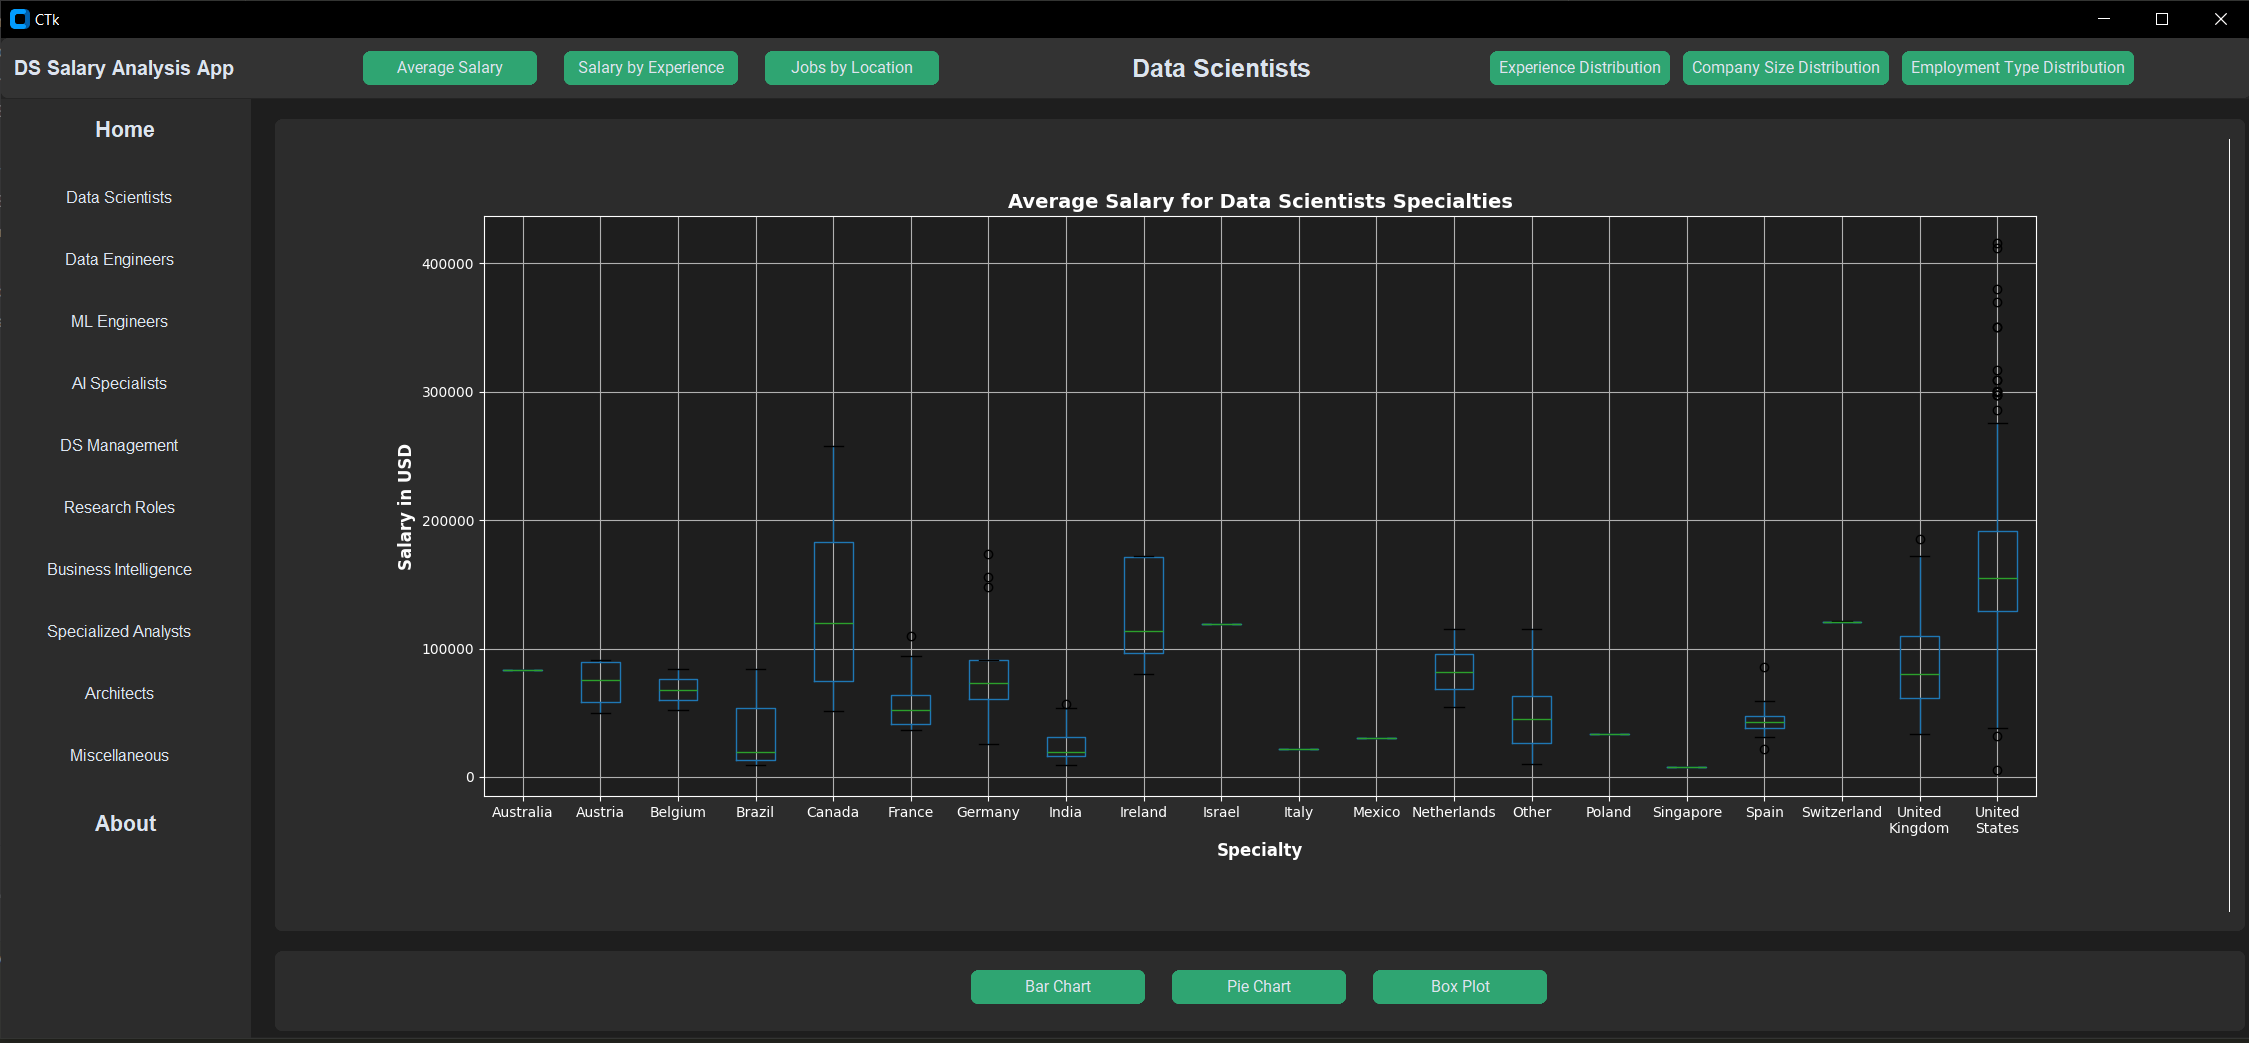
This shows a box plot for the selected dataset. Such statistics are available for:
- Average salary
- Salary by experience
- Jobs by location
- Experience distribution
- Company size distribution
- Employment type distribution
Pie Chart
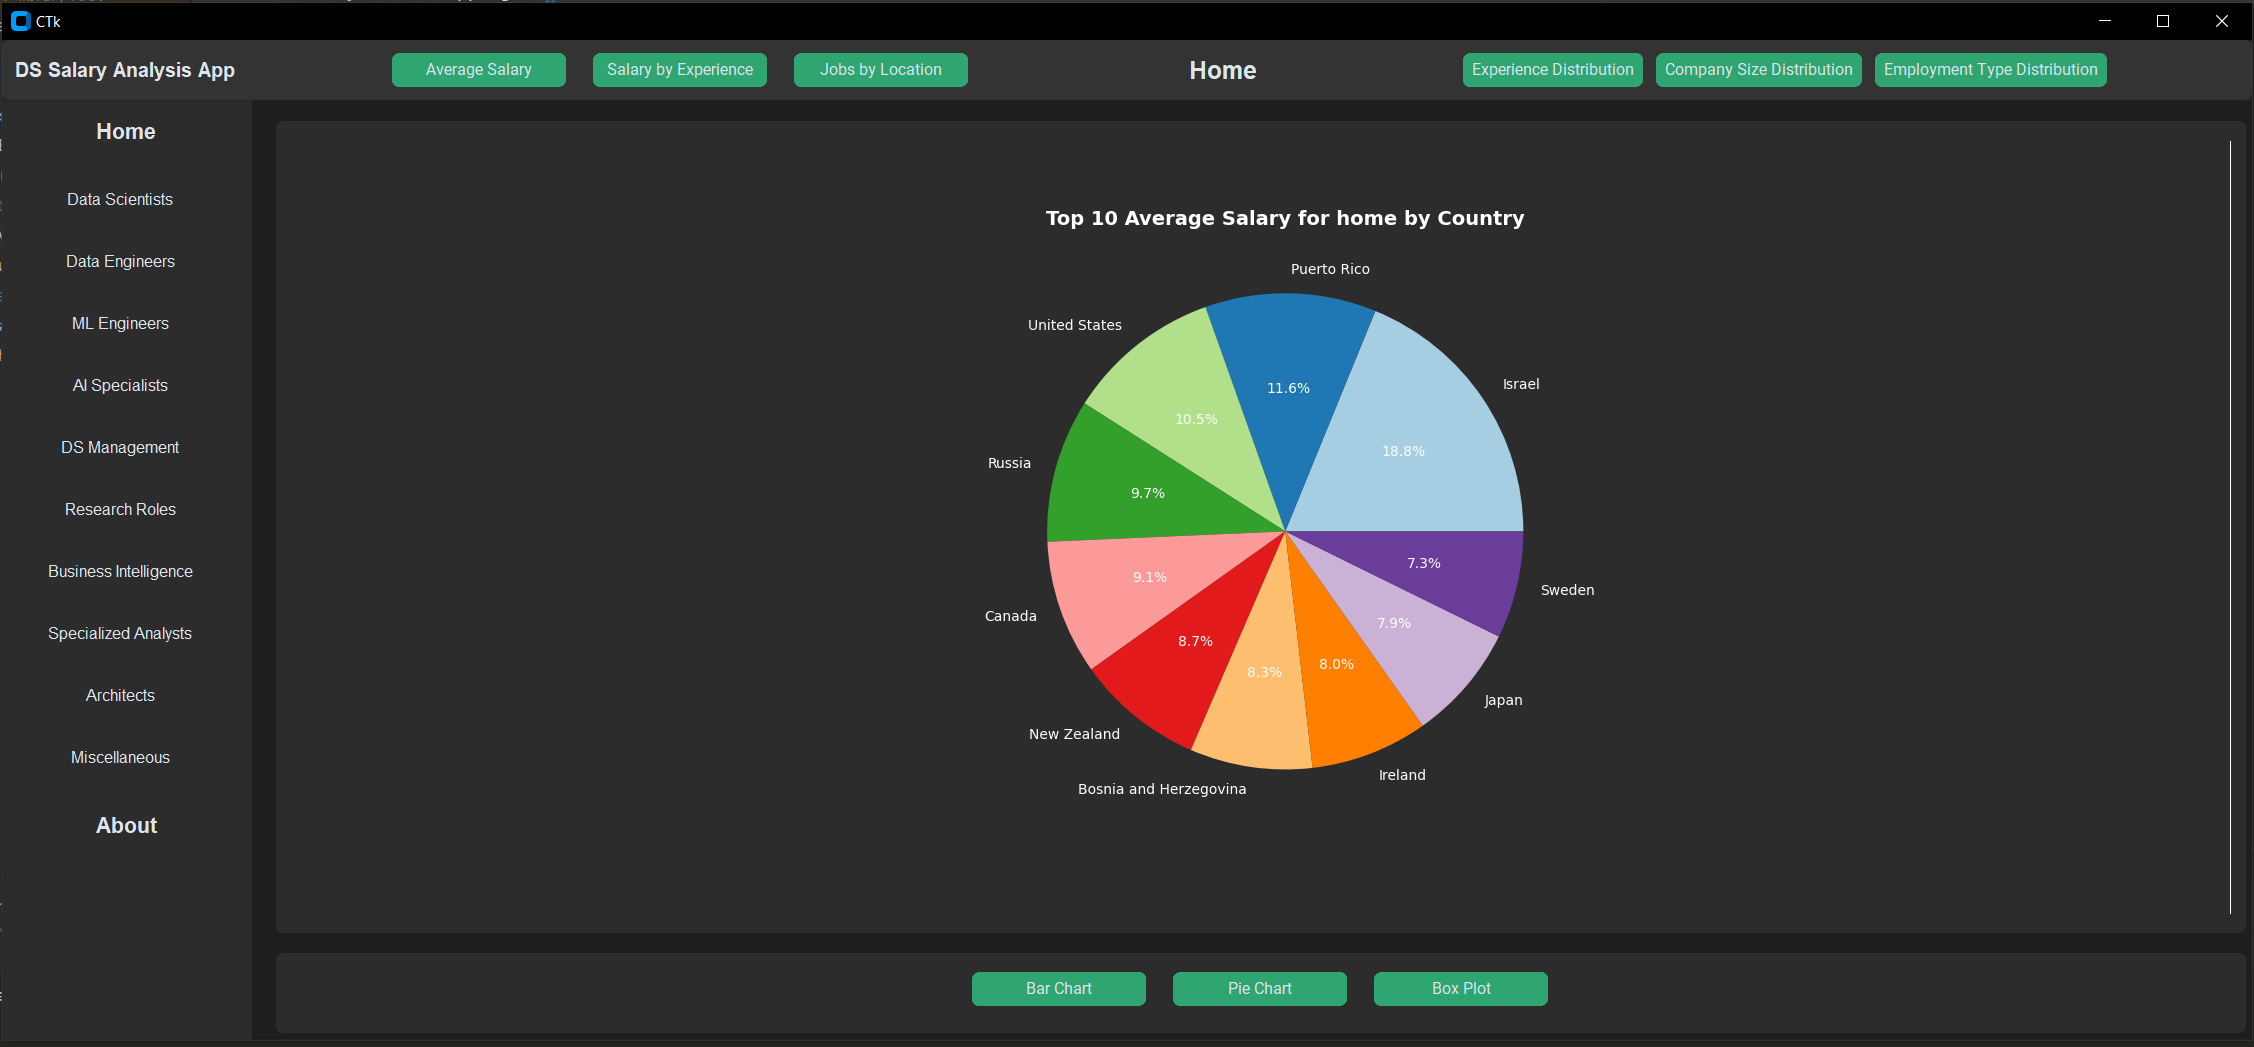
This demonstrates a pie chart for the selected dataset. Such statistics are available for:
- Average salary
- Salary by experience
- Jobs by location
- Experience distribution
- Company size distribution
- Employment type distribution
Group Example: ML Engineers
Examples of job titles in the 'ML Engineers' category include:
- ML Engineer
- Machine Learning Engineer
- Applied Machine Learning Engineer
- Machine Learning Scientist
- Deep Learning Engineer
- Machine Learning Software Engineer
- Machine Learning Research Engineer
- NLP Engineer
- Machine Learning Developer
- Principal Machine Learning Engineer
- Lead Machine Learning Engineer
Setup
To set up the project, you will need the following libraries:
- Pandas
- Matplotlib
- CustomTkinter
Follow these steps to set up the project:
- Clone the repository from GitHub.
- Install the required libraries using `pip install -r requirements.txt`.
- Run the application using `python main.py`.
Source Code
You can view the source code: HERE